
Estimated read time: 8 minutes | Target: Functional Consultants & Finance Teams
If the General Ledger is the heart of Business Central, the Chart of Accounts is its skeleton. Get it right and everything else reporting, auditing, financial analysis — flows naturally. Get it wrong and you’ll spend years working around a structure that was never fit for purpose.
I’ve set up Chart of Accounts structures for businesses ranging from 10-person trading companies to 200-person manufacturers. Here is everything I wish someone had told me before my first one.
Why the Chart of Accounts Decision Is So Hard to Reverse
Before we get into the how, let’s talk about the why specifically why this decision deserves more time than most project teams give it.
Once transactions start posting against GL accounts, restructuring becomes painful. You can add new accounts relatively easily. But merging accounts, renumbering, or fundamentally changing the structure after go-live means historical data no longer aligns with your new structure. Auditors don’t like it. Finance teams don’t like it. And it creates reporting headaches that can last for years.
This is a design-once, live-with-it-for-a-long-time decision. Treat it accordingly.
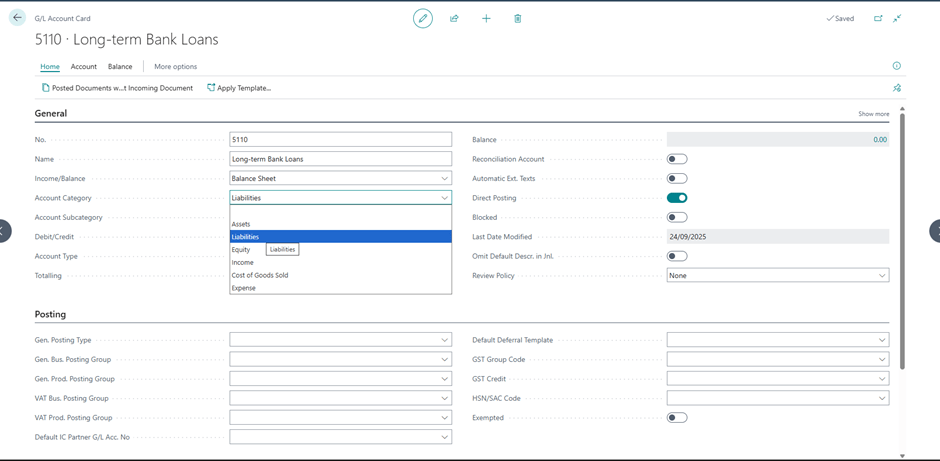
1. Understand the Account Categories First
BC organises GL accounts into Categories and Subcategories. This is not just cosmetic Account Categories drive the built-in Financial Reports (Balance Sheet, Income Statement, Cash Flow) that BC generates automatically.
The main categories are:
- Assets
- Liabilities
- Equity
- Income
- Cost of Goods Sold
- Expense
Before you build a single account, sit with the Finance team and confirm which subcategories they need. Do they want to split Operating Expenses from Administrative Expenses? Do they need a separate COGS category for raw materials versus labour? These decisions shape everything downstream.
Practical tip: Run the default BC Chart of Accounts from a demo environment as your starting point. It’s a well-structured template that covers most SMB needs. Build from it rather than starting from a blank page you’ll save hours and avoid common omissions.
2. The Numbering Structure — More Important Than Most People Think
BC doesn’t enforce a specific numbering convention, but your numbering structure will determine how easy your Chart of Accounts is to maintain, extend, and report against for years to come.
The convention I recommend for most SMB clients:
| Range | Category |
|---|---|
| 1000–1999 | Assets |
| 2000–2999 | Liabilities |
| 3000–3999 | Equity |
| 4000–4999 | Income / Revenue |
| 5000–5999 | Cost of Goods Sold |
| 6000–8999 | Operating Expenses |
| 9000–9999 | Other Income / Expense |
Why the gaps matter: Always leave room within each range. If your client has 15 expense accounts today, don’t number them sequentially from 6000 to 6015. Number them 6000, 6100, 6200 leaving room to insert new accounts logically as the business grows without breaking the structure.
I’ve inherited Chart of Accounts where every number was sequential with no gaps. Adding a new account meant either cramming it at the end of the wrong range or renumbering both are terrible options.
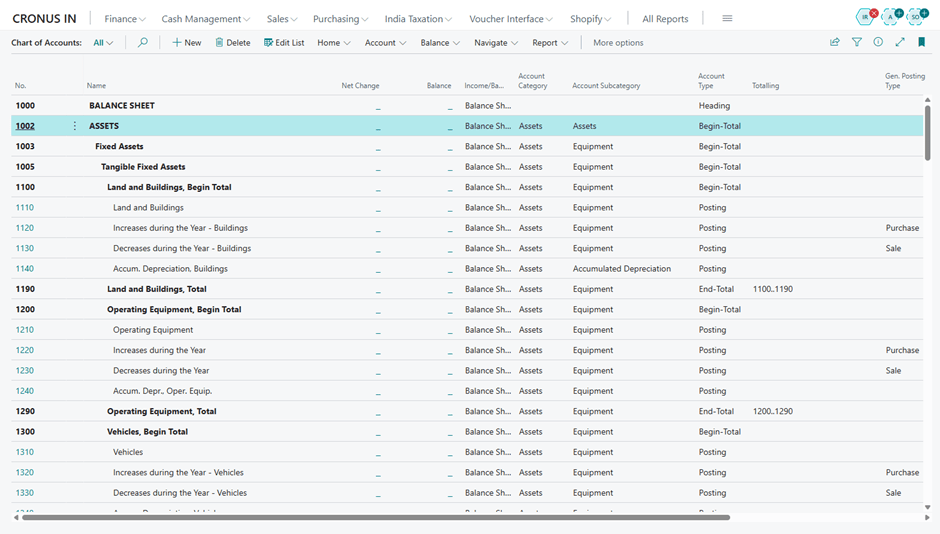
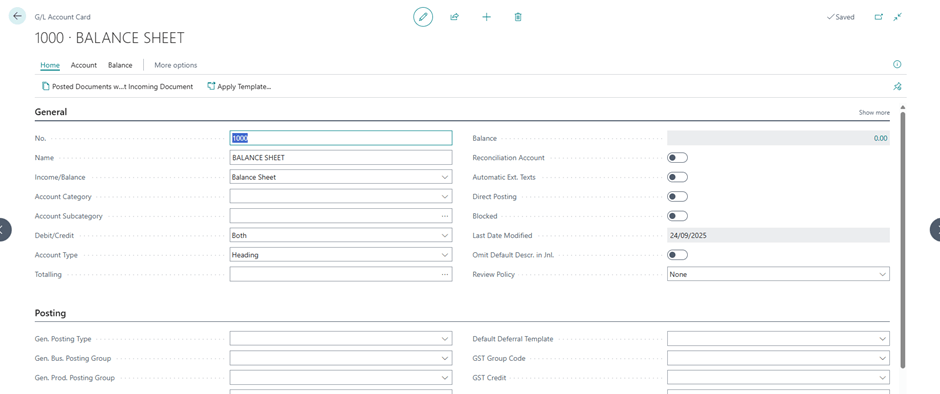
3. Heading Accounts vs Posting Accounts
In BC, GL accounts have an Account Type:
- Posting — actual accounts where transactions are recorded
- Heading — non-posting accounts used purely for visual grouping and subtotalling in reports
- Begin-Total / End-Total — used to create subtotals in the Chart of Accounts view
New consultants often underuse Heading and Totalling accounts. A well-structured Chart of Accounts uses these to create clear visual sections making it far easier for Finance teams to navigate and for auditors to follow.
Example structure:
6000 OPERATING EXPENSES [Heading]6100 Salaries & Wages [Posting]6200 Employer Social Costs [Posting]6300 Office Rent [Posting]6400 Utilities [Posting]6900 Total Operating Expenses [End-Total]
This structure means the Chart of Accounts is self-documenting anyone opening it for the first time can understand it immediately.
4. The Dimensions Question — Don’t Over-Account
This is the single most common Chart of Accounts mistake I see: businesses that use GL accounts where they should be using Dimensions.
A classic example: a client with three departments Sales, Operations, and Finance who wants to see department-level P&L. The wrong approach is to create separate expense accounts for each department:
6100 Salaries — Sales6110 Salaries — Operations 6120 Salaries — Finance
This multiplies your Chart of Accounts unnecessarily. With 10 expense types across 3 departments you suddenly have 30 accounts instead of 10. Add a fourth department and the problem compounds.
The right approach: one Salaries account, with a Department Dimension that tags every transaction to the correct department. Your Chart of Accounts stays clean. Your reporting becomes flexible you can slice by department, or remove the filter entirely for a consolidated view.
Rule of thumb: If you find yourself creating near-identical accounts that differ only by department, product line, or region stop. That’s a Dimensions conversation, not a Chart of Accounts conversation.
(We’ll cover Dimensions in depth in the next post.)
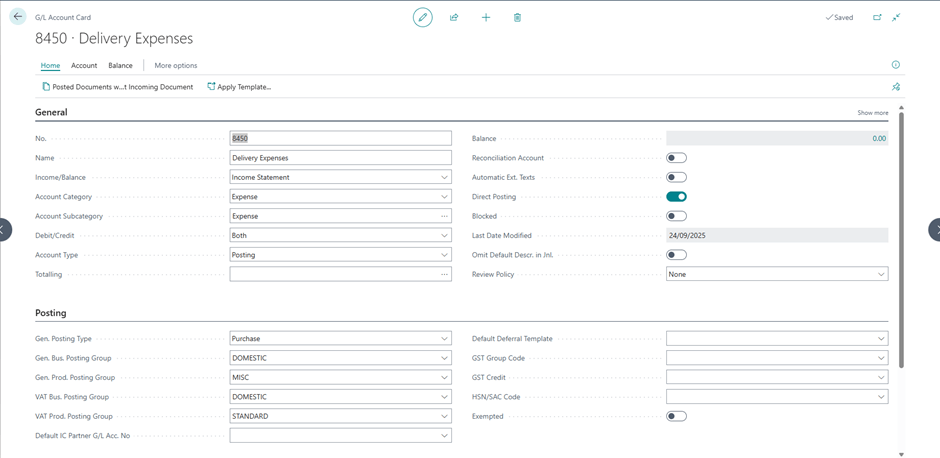
5. Direct Posting — Know When to Switch It Off
Every posting account in BC has a Direct Posting toggle. When enabled, users can post directly to that account from journals. When disabled, the account can only be posted to through automated posting groups.
For control accounts Accounts Receivable, Accounts Payable, Inventory you should always disable Direct Posting. These accounts should only ever be updated through their respective sub-ledgers (Customer Ledger, Vendor Ledger, Item Ledger). Allowing direct journal entries to these accounts breaks the reconciliation between the sub-ledger and the GL, which is one of the most painful issues to untangle after the fact.
Practical tip: After your Chart of Accounts is set up, run through every account that is linked to a Posting Group and confirm Direct Posting is switched off.
6. Review With the Auditors Before Go-Live
This one is often forgotten until it’s too late. Your client’s external auditors will have opinions about the Chart of Accounts structure particularly around how Income and Expense categories map to statutory reporting requirements.
In some countries, statutory accounts must follow a prescribed format. In others, there’s flexibility but auditors have preferences based on what makes their year-end process easier.
A 30-minute conversation with the client’s audit firm before go-live can save weeks of restructuring later. Put it in your project plan as a formal checkpoint.
A Real-World Example
On a recent implementation for a mid-sized distribution company, the Finance Director handed me a Chart of Accounts from their old system 312 accounts, most of which hadn’t been posted to in years. By the time we’d removed redundant accounts, consolidated duplicates, and replaced department-specific accounts with Dimensions, we had a clean, logical structure of 87 accounts.
The Finance Director’s comment at go-live: “This is the first time I’ve actually understood our own Chart of Accounts.”
That’s the goal.
Conclusion: Invest the Time Upfront
The Chart of Accounts conversation is not glamorous. Clients don’t get excited about account numbering. But the consultants who get this right who push back on over-complexity, who introduce Dimensions at the right moment, who insist on auditor sign-off before go-live are the ones whose implementations age well.
Do the hard work now. Your future self and your client will thank you.
📚 Your Next Step — Official Microsoft Learn Paths
| Topic | Learn Path |
|---|---|
| Financial Management in BC | Use Financial Management in BC |
| MB-800 Certification | MB-800 Exam Preparation |
Next up: Post #7 — How to Configure Dimensions in Business Central (and Why They Matter). If this post left you with questions about Dimensions, that one answers all of them.
What’s the most unusual Chart of Accounts structure you’ve inherited on a project? Share it in the comments I have a feeling the stories will be good.

Leave a comment